How to Use Browser DevTools for Beginners: A Guide
How do you use browser DevTools as a beginner? Open Console for errors and Network for live requests, so you can see exactly what a page is doing.

You reload a page and the data you expected just isn't there. No error message on the screen, no clue what went wrong, nothing to click. The page looks fine and broken at the same time, and there's no way to see what happened between your browser and the server.
Every browser has a built-in tool for exactly this: DevTools, and it's one click away. It shows you the page's code, its errors, and every request it made. Three tabs matter most for a beginner: Console, where your code's output and errors show up; Network, where you can watch requests happen live; and Elements, a safe place to poke at the page without changing anything real.
Key Takeaways
- DevTools opens with a right-click and Inspect, or the F12 key, in any modern browser
- The Console tab shows JavaScript output and errors, including anything you send with
console.log()- The Network tab shows every request a page makes, and you can click one to see its full request and response
- Nothing you do in DevTools is saved or visible to anyone else, so there's nothing to break
- Filtering the Network tab by
fetch/xhrcuts a long list of files down to just the actual data requests
What Are Browser DevTools, and How Do You Open Them?
Browser DevTools is a free panel built into every browser that shows you a page's HTML, its JavaScript errors, and every network request it made. Think of it as an X-ray machine for any website. It doesn't add anything to the page. It just shows you what's already there.
Open it by right-clicking anywhere on a page and choosing Inspect, or by pressing F12 (Cmd+Option+I on a Mac). A panel appears, usually docked to the side or bottom of the window, with a row of tabs across the top: Elements, Console, Network, and a few others you won't need yet.
Nothing you do in here is saved. You can click around, break things on purpose, and refresh the page to reset everything back to normal. If you skip learning this tool, every "why isn't this working" moment stays a guessing game instead of something you can actually look at.
The Console Tab: Where Your Code Talks Back
If you've written console.log() before, you've already used the Console tab without fully knowing what it was. This is the tab where that output actually lands: not on the visible page, but in this separate panel.
The Console also shows JavaScript errors, usually in red. That red text feels alarming the first time you see it, but it isn't a verdict that the whole page is broken. It's a specific line telling you exactly what went wrong and where, which is more information than you had a second ago, not less.
Click the arrow next to a red error to expand it. Underneath is the file and line number where it happened, and often a link straight to that source code.
Skip the Console tab and you're stuck guessing whether your code ran at all. With it open, you can confirm a script fired, check a variable's actual value, or find the exact line an error came from instead of rereading your whole file line by line. The MDN guide to browser developer tools covers every tab in more depth once these two feel familiar.
The Network Tab: Watching Requests Happen Live
Most beginners never open this tab, even though it's the best place to see GET and POST requests actually happen. Click Network, then reload the page. A list appears, and it's usually longer than you expect: images, fonts, scripts, and the actual data requests, all mixed together.
Which one is the real request? Type fetch or xhr into the filter bar at the top, and the list shrinks down to just the requests that fetched data. Click any one of them, and you'll see its full URL, its method (GET or POST), its headers, and the response it got back. I check this tab first whenever something I've built isn't showing the data it should, since watching the request happen is faster than rereading my own code line by line.
If a request's status shows red, click it and check the status code first. A 404 means the URL was wrong. A 500 means something broke on the server, not in your code.
Without the Network tab, an API call is invisible: you only see whatever the page decides to show you. With it open, you can watch the request leave, see exactly what came back, and catch a wrong URL or a missing header before you spend an hour guessing at the cause. The Chrome DevTools Network reference covers the full set of filters if you want to go further than fetch/xhr.
The Elements Tab: A Safe Place to Experiment
The Elements tab shows the page's live HTML and CSS, and lets you edit both directly in the browser. It's also what people mean when they say "inspect element": right-click, choose Inspect, and Elements is the tab you land on. Change a color, delete a paragraph, resize a button: none of it is saved, and none of it changes the real file. Refresh the page and it's all back to normal.
Skip this tab and you end up testing every idea the slow way: editing the real file, saving, and refreshing, over and over, just to see if a padding value looks right. With Elements open, you get the answer in seconds, before touching a single line of actual code.
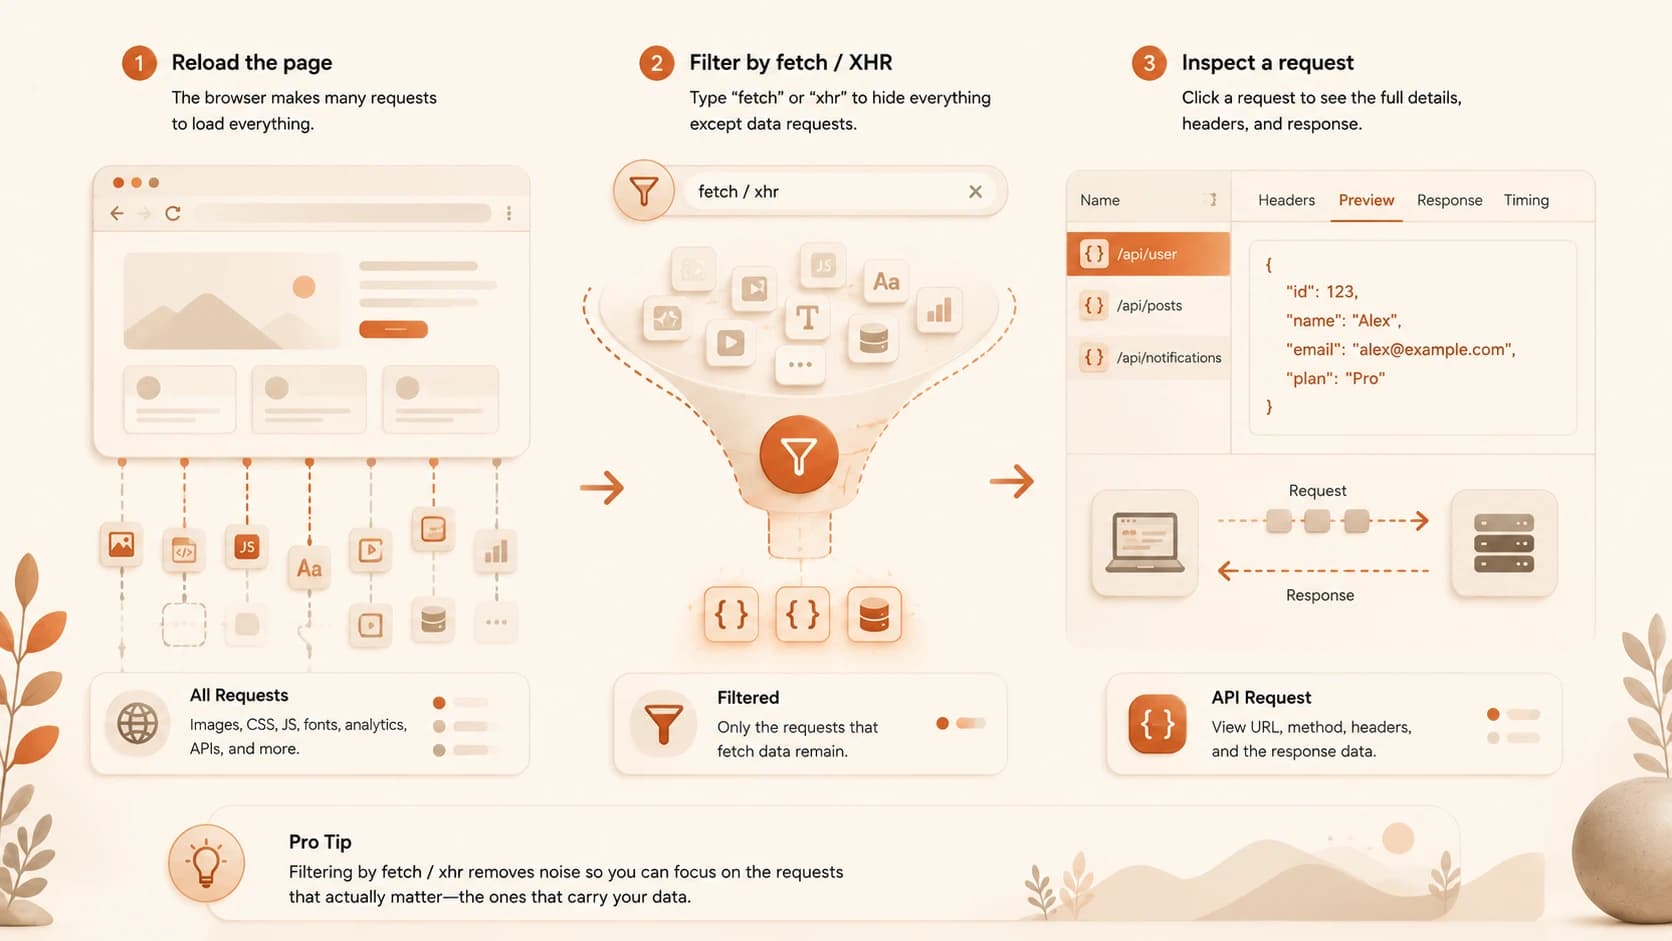
Open a site and the Network tab
Go to github.com (it reliably shows live data requests, which is why it's the pick here over a mostly static page).
Open DevTools (right-click and choose Inspect), then click the Network tab.
Reload and filter the list
Reload the page. A long list of requests will appear.
In the filter bar, type fetch or xhr to narrow the list down to real data requests, not images or styling files. If the list looks empty, reload once more. Some requests fire a second after the page loads.
Read one request
Click on one request in the filtered list. Look at its URL and its method (GET or POST), then click Response or Preview (just "Response" in Firefox) to see the data it returned.
You should see readable data, usually JSON, not a wall of HTML. That's your signal you clicked the right row.
You just watched an API call happen in real time, live on an actual website, using the same GET and POST pattern from the last two lessons.
Done? You've completed Lesson 06.07.
FAQ