Code Execution with MCP: Cut Token Costs Nearly 98%
Code execution with MCP turns servers into code modules an agent explores on demand. Learn how it cut a real workflow from 150,000 tokens to just 2,000.

Somewhere around the fourth MCP server I'd connected, the same request that used to answer in a couple of seconds started taking noticeably longer, and I hadn't changed a single line of my own code. The server I secured last lesson was still fine. The GitHub server I'd connected earlier in this module was still fine too. What had changed was how much of the model's context every one of those servers was spending just to describe itself, before I'd typed a word.
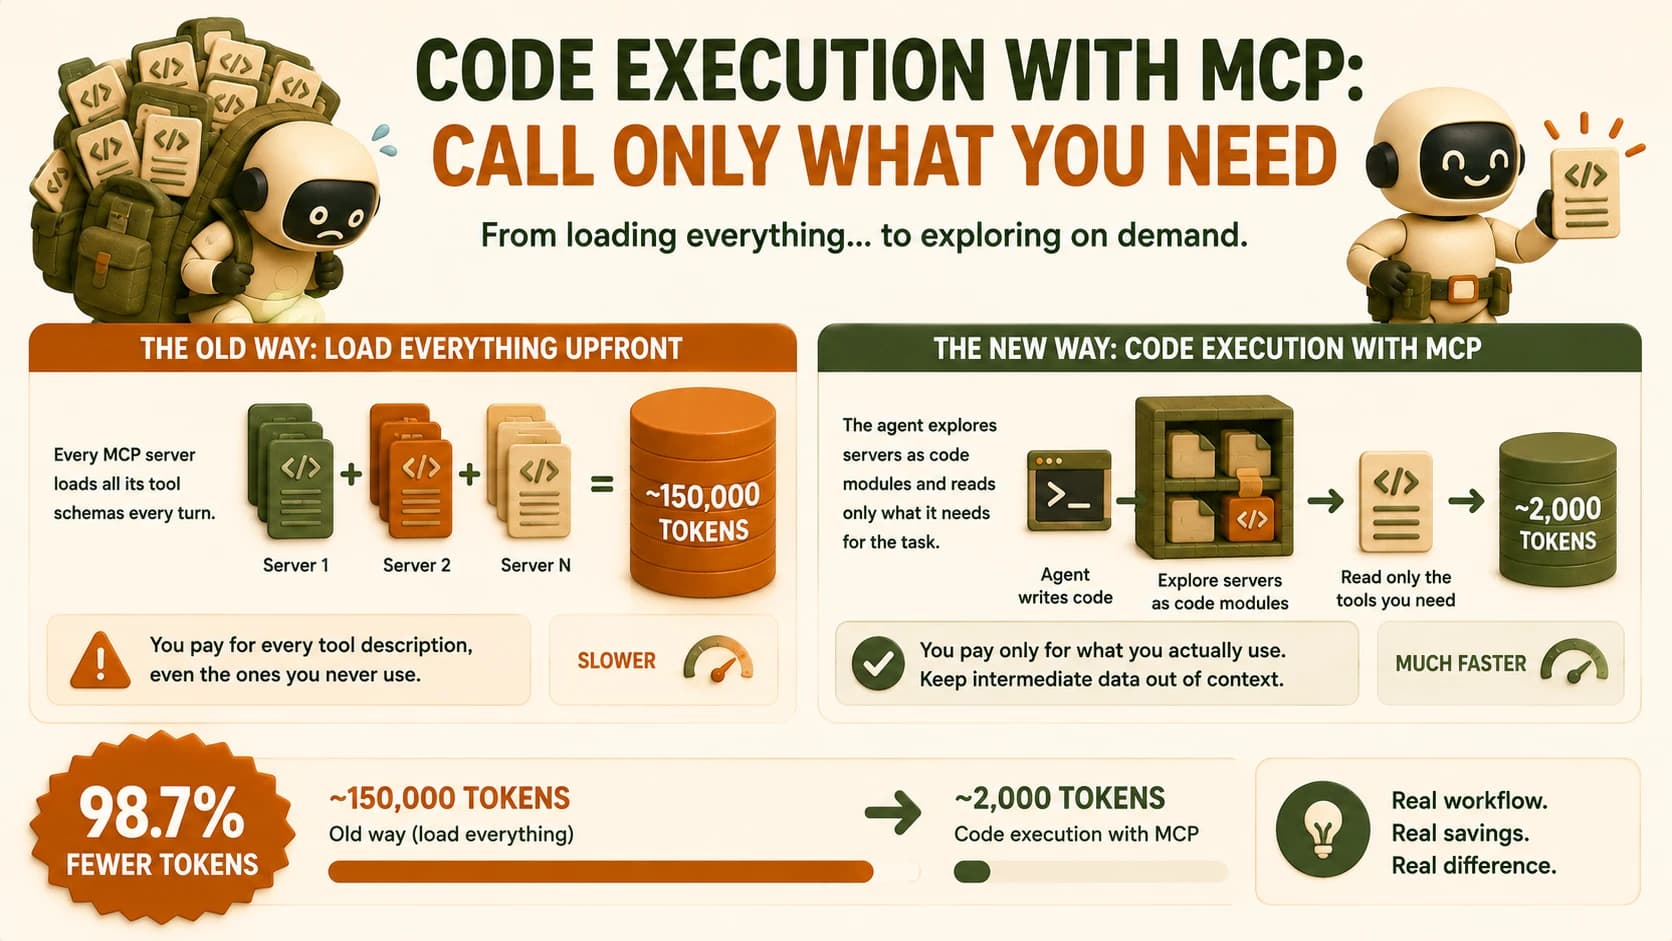
Code execution with MCP means presenting your MCP servers as code modules an agent can explore and call from written programs, instead of loading every tool's full schema into context up front. Anthropic's own case study took a real workflow from around 150,000 tokens down to about 2,000, a 98.7% reduction, by letting the agent read only the tool definitions a task actually needs and keeping intermediate results out of the model's context entirely.
Key Takeaways
- Loading every connected MCP server's tool schemas up front can burn tens of thousands of tokens before the model starts reasoning, and a single ~94-tool server like GitHub's can account for a big share of that alone
- Anthropic's code execution pattern presents servers as a filesystem of code modules the agent reads on demand, cutting one real workflow from 150,000 tokens to about 2,000
- It's a different fix from MCP's Tool Search feature, which still calls tools directly, just discovers them later instead of loading them all at once
- The technique applies directly to your own multi-server setup, and you'll measure the before-and-after yourself in this lesson's lab
- It isn't free: running agent-generated code safely requires a real sandboxed execution environment, which is why it's worth doing at scale, not by default
Why Loading Every MCP Tool Upfront Gets Expensive
Every MCP server you connect injects its tools' full JSON schemas into the model's context on every single turn, whether or not that turn ever calls one of them. A handful of servers with a modest number of tools each adds up fast, and a few large ones can dominate the whole conversation before it begins.
The numbers here are concrete, not hypothetical. A setup with around five MCP servers can spend roughly 55,000 tokens on schemas alone before you type a prompt. The GitHub MCP server you connected earlier in this module is about 94 tools, consuming roughly 17,600 tokens of definitions on its own, every single request. That's also exactly the kind of server that fills Cursor's tool-count ceiling, capped around 40, before you've added anything else. Stack a few servers like that together and you can lose 70% or more of a 200,000-token context window to tool descriptions the current task doesn't need.
That's context the model can't spend on your actual work: the file it's reading, the plan it's building, the answer it's assembling. Every schema token is a token that isn't your task.
What Code Execution With MCP Actually Changes
Instead of handing the model every tool's schema directly, code execution with MCP presents your connected servers as a filesystem of code modules, and the agent writes a program that calls the specific functions it needs. Anthropic's own example structures it like a directory tree: servers/google-drive/getDocument.ts, servers/salesforce/updateRecord.ts, and so on, one file per tool, organized by server.
The agent never gets all of that dumped into context at once. Instead:
- It explores the tree the way you'd browse a folder, seeing server and tool names but not their full schemas yet.
- It reads only the one or two module files a given task actually requires.
- It writes real code against them, something closer to
const transcript = await gdrive.getDocument({ documentId }).contentthan a sequence of individual tool-call messages. - The data itself, a full transcript, a large query result, whatever it is, moves through the execution environment directly instead of round-tripping back through the model's context twice.
If you've worked through CodeAct, this will feel familiar: the same underlying idea, an agent writing and running code instead of emitting one tool call per step, applied specifically to how MCP tools get exposed in the first place. CodeAct is the general principle. Code execution with MCP is that principle pointed at the exact spot where MCP's own overhead was piling up.
Code Execution vs Tool Search, Not the Same Fix
Tool Search and code execution both reduce what a model has to hold in context, but they work in different places, and conflating them will cost you debugging time later. Tool Search still uses ordinary, direct tool-calling: the model just discovers which tools exist through a search step instead of having every schema pre-loaded, which Anthropic reports cutting overhead by roughly 85%. The final tool call still carries a full schema, it's just fetched only when needed.
Code execution never exposes a schema to the model at all. The agent writes code against a generated API surface, and the protocol-level tool-calling step disappears from the loop entirely for that interaction. Tool Search is the lighter-touch fix. Code execution is the deeper structural change, which is why its token savings run an order of magnitude larger when it applies.
Measuring Token Savings on Your Own MCP Setup
What you're actually measuring is the token cost of tool definitions injected into context for one task, run once the old way and once with on-demand code-execution loading. That's the whole comparison: same task, same servers, two different loading strategies, one number for each.
The "before" side is exactly what you've been running since Module 18 started: the FastMCP notes server you built earlier, plus the GitHub server, exposing their full schemas on every turn regardless of whether that turn calls add_note, search_notes, or anything from GitHub's roughly 94. The "after" side is the same two servers, restructured so the agent discovers and reads only the module it actually calls for a given task.
I caught the sharpest edge of this on the first pass I ran. The sandboxed environment I'd set up wasn't scoped tightly enough, and the agent's generated code could reach files outside the project directory I'd meant to limit it to. It didn't do anything malicious with that access; it just had it, and I only noticed because I was watching the actual tool calls during the run rather than trusting the setup. Fixing it meant adding an explicit path allowlist before I trusted the environment to run unattended. That's the real cost side of this technique: the token savings are genuine, but the sandboxing has to be genuine too.
Token cost by loading strategy, same task, two servers (notes server + GitHub)
| Loading strategy | What's in context every turn | Approximate token cost |
|---|---|---|
| Direct tool-calling (all schemas loaded) | Full schemas for every tool on both servers | Tens of thousands, dominated by GitHub's ~94-tool catalog |
| Code execution (on-demand loading) | Only the module(s) the current task actually calls | A small fraction of the above, comparable to Anthropic's 150,000 → 2,000 result |
Run the same comparison on your own setup in this lesson's lab, and you'll have two real numbers instead of one vendor's case study.
When Code Execution Is Worth the Setup Cost
Code execution earns its complexity once your schema overhead is large enough to actually hurt you, and for a two- or three-server setup, it usually isn't there yet. Anthropic's own post is direct about the tradeoff: running agent-generated code safely means a real sandboxed execution environment with resource limits and monitoring, not a config flag you flip on. That's genuine engineering work, not a free upgrade.
If you're running the notes server and one or two others, the honest answer is you probably don't need this yet. The payoff scales with the number of servers and tools you've connected. That's exactly why this lesson sits where it does in the path: after you've built, deployed, and secured a real server, and after you've connected a large third-party one like GitHub. Once you're carrying that much schema weight, solving it structurally beats tolerating it.
If your context usage is dominated by one oversized server rather than many small ones, start by checking whether that single server exposes a scoped or partial tool set before reaching for a full code-execution rebuild of everything you've connected.
Your Lab
Measure the baseline
In Cursor or Claude Code, with the notes server from 18.07 and the GitHub server from earlier in this module both connected normally (direct tool-calling, full schemas loaded), run one real task: ask the agent to search your notes for a specific term and then check whether a matching GitHub issue exists. Record the token count MCP tool definitions add to that turn: in Claude Code, check the /cost or /context output right after the turn; in Cursor, open the request's token breakdown in its usage panel. Either way, you're isolating the tool-definition portion, not your whole conversation's token count.
Convert to on-demand loading
Restructure the same two servers so their tools are exposed as a filesystem of code modules instead of pre-loaded schemas, following the directory pattern from this lesson: one file per tool, organized by server, so you'd end up with something like servers/notes/add_note.py and servers/notes/search_notes.py next to servers/github/ and its own tool files. Confirm the agent can list and read a module on demand before it calls anything.
Run the same task again
Repeat the exact same task from Step 1, using the on-demand code-execution setup. Record the token count for tool definitions on this run.
Commit the numbers
In learning-log.md, commit both token counts and the delta between them, plus one sentence on what changed in your setup to get there.
Done? You've completed Lesson 18.11.
FAQ